MetONTIIME
Overview
MetONTIIME is a Meta-barcoding pipeline for analysing ONT data in QIIME2 framework. Starting from v2.0.0, the pipeline is based on Nextflow, to allow for easier installation and better execution monitoring.
The MetONTIIME pipeline requires you to open metontiime2.conf configuration file and set the desired options. Then, you can run the pipeline using either docker or singularity environments just specifying a value for the -profile variable.
MetONTIIME utilizes a pipeline built around the Nextflow workflow management system . Here's a breakdown of the typical steps involved:
-
Preparation:
- You'll need to configure the pipeline using the
metontiime2.conffile. This involves specifying options like input/output directories and desired analysis parameters.
- You'll need to configure the pipeline using the
-
Data Input:
- The pipeline expects raw sequencing data in FASTQ format as input.
-
Preprocessing:
- MetONTIIME leverages tools within the QIIME2 framework to perform quality control and filtering on the raw reads.
-
Adapter Trimming:
- Adapter sequences used during library preparation are identified and removed from the reads.
-
Demultiplexing (Optional):
- If your data contains samples with unique barcodes, MetONTIIME can demultiplex them to separate files for each sample.
-
Denoising (Optional):
- Depending on the sequencing technology (e.g., Nanopore), denoising algorithms may be applied to improve read accuracy.
-
OTU Clustering:
- Operational Taxonomic Units (OTUs) are defined, representing groups of sequences likely originating from the same species.
-
Chimera Removal:
- Artificial sequences formed during PCR amplification (chimeras) are identified and removed.
-
Taxonomic Classification:
- MetONTIIME utilizes tools like Kraken2 to classify the OTUs into different taxonomic categories (e.g., phylum, genus).
-
Diversity Analysis:
- The pipeline calculates various diversity metrics (alpha and beta diversity) to assess the richness and composition of microbial communities in the samples.
- Output:
- The results include OTU tables, taxonomic classifications, and diversity metrics, typically stored in formats compatible with further analysis in QIIME2.
Note: This is a general overview, and the specific steps involved might vary depending on the configuration options chosen and the version of MetONTIIME used.
Usage
The MetONTIIME pipeline requires you to open metontiime2.conf configuration file and set the desired options. Then, you can run the pipeline using either docker or singularity environments just specifying a value for the -profile variable.
Database
MetONTIIME pipeline allows the users to choose the database according to the marker gene sequenced and to their preferences. Some marker gene reference database, as SILVA (16S/18S rRNA), GreenGenes (16SrRNA) and UNITE (fungal ITS) are already formatted for use with QIIME2, as they are available as a pair of sequences (fasta) and taxonomy (tsv) files, and they can therefore be easily imported as QIIME2 artifacts (qza). In case you downloaded a fasta file from NCBI and you want to obtain the corresponding taxonomy tsv file, you can use TaxonomyTsv_from_fastaNCBI.R script. This R script requires an R installation with taxize and Biostrings packages installed. For example, if you want to use the same database used by the EPI2ME 16S workflow for bacterial 16S gene, you can go to BioProject 33175, click send to, select Complete Record and File, set the Format to FASTA and then click Create File; the corresponding taxonomyTsv file can then be created with:
- Rscript /path/to/TaxonomyTsv_from_fastaNCBI.R \
- dbSequencesFasta="/path/to/input/dbSequences.fasta" \
- dbTaxonomyTsv="./path/to/output//dbTaxonomy.tsv" \
- ENTREZ_KEY="myentrezkey"
Output explanation
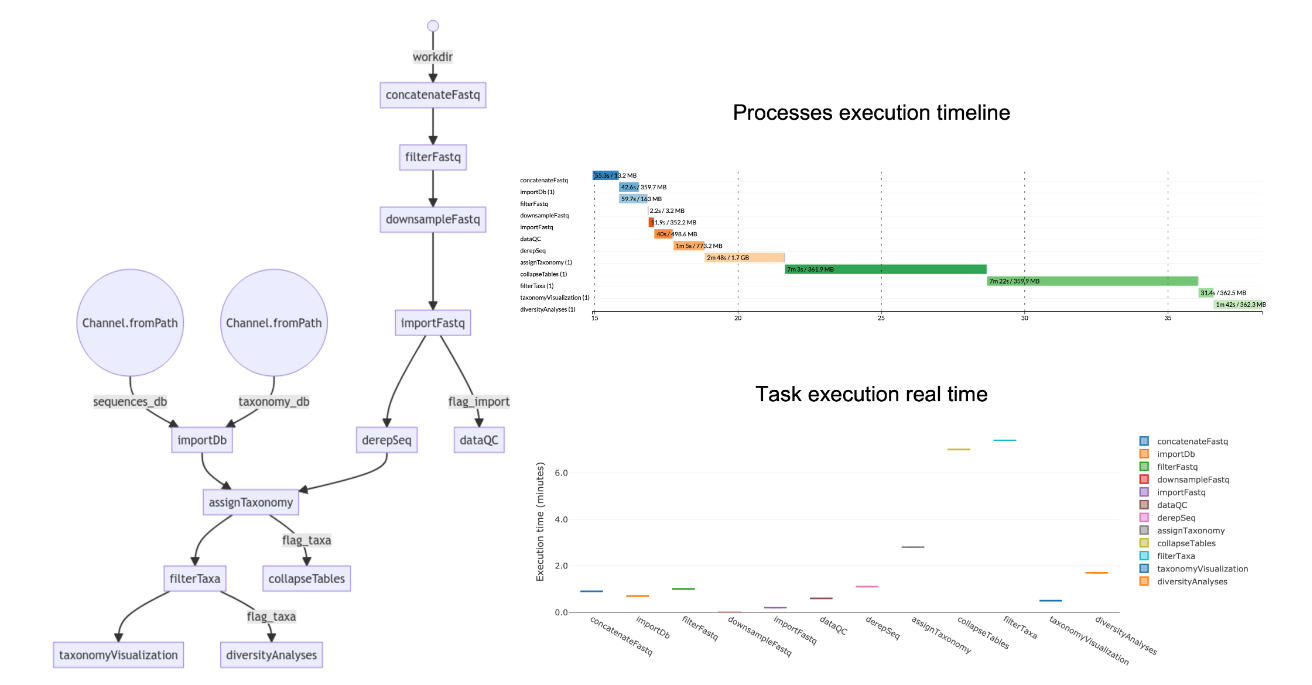
The pipeline is composed of a set of processes. They can be optionally turned-off by setting them to "false" in the metontiime2.conf file.
- importDb: import a fasta file with sequences dbSequencesFasta and a tsv file with sequence ids and multi-level taxonomy (with each level separated by ';') dbTaxonomyTsv as a pair of QIIME2 artifacts dbSequencesQza and dbTaxonomyQza.
- concatenateFastq: in case workDir is the output directory generated by MinKNOW, this process concatenates all fastq files corresponding to each barcode (in workDir/barcode<num>) and compresses them to fastq.gz; if workDir already contains fastq.gz files for each barcode, set the process to "false".
- filterFastq: filter fastq.gz files based on length (minReadLength, maxReadLength) and quality (minQual). Moreover, trim extraEndsTrim bases from both sides.
- downsampleFastq: cap the amount of sequencing reads for each sample to maxNumReads.
- importFastq: import filtered fastq.gz files as QIIME2 artifacts.
- dataQC: evaluate sequencing reads quality/length statistics.
- derepSeq: perform clustering at clusteringIdentity identity (in case clusteringIdentity=1 , perform dereplication only), and obtain a set of representative sequences and their abundance.
- assignTaxonomy: assign taxonomy to representative sequences using classifier classifier, retrieve up to maxAccepts hits filtered by minIdentity and minQueryCoverage, and perform consensus taxonomy assignment.
- collapseTables: collapse feature tables at the available taxonomy levels.
- filterTaxa: retain only reads from taxaOfInterest and discard samples with less than minNumReadsTaxaOfInterest assigned to that taxa. In case you do not want to focus the analysis on a specific taxa, set the process to "false".
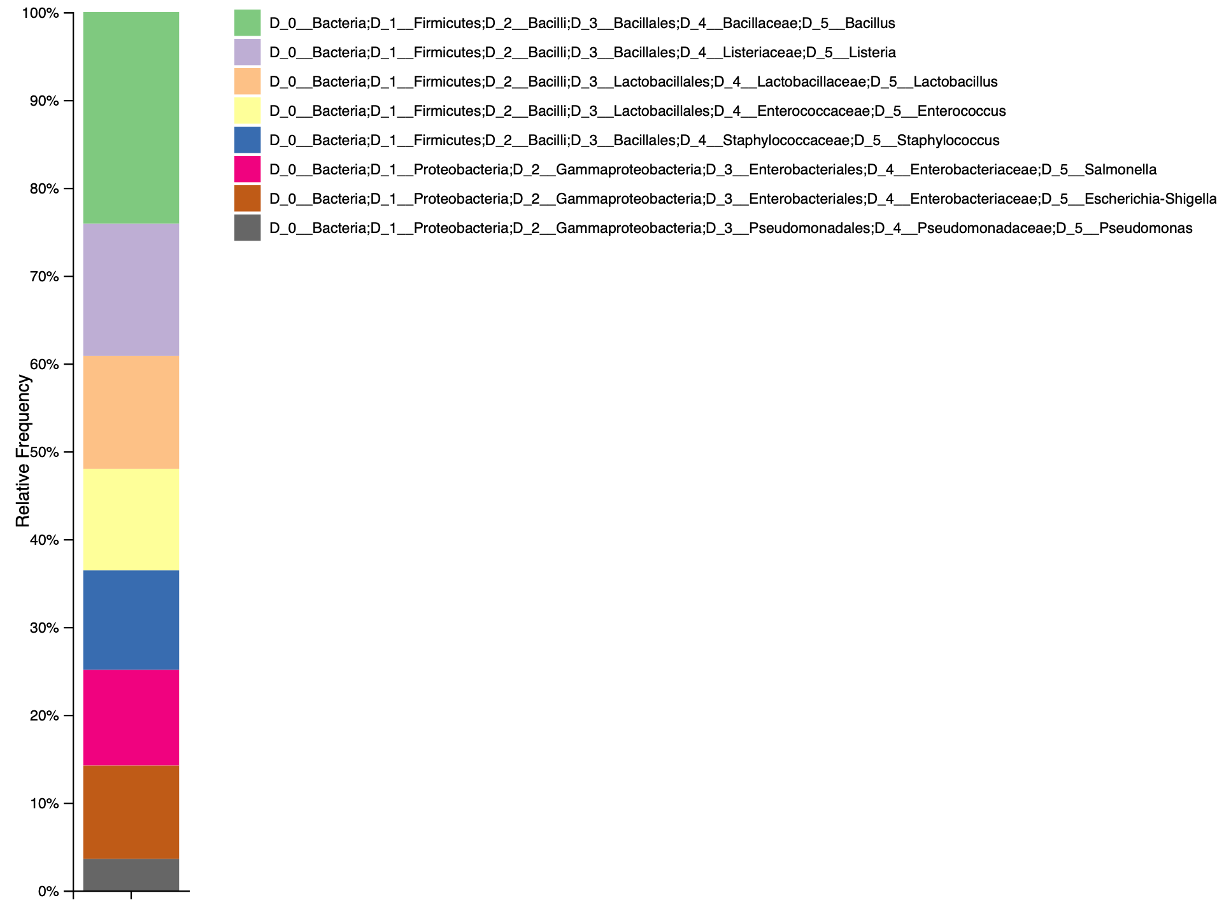
- taxonomyVisualization: produce barplots describing the relative abundance of all taxa, all taxa excluding "Unclassified" reads, and of taxaOfInterest (if any).
- diversityAnalyses: evaluate non-phylogenetic alpha- and beta-diversity indexes at taxaLevelDiversity level, either for all taxa or for taxaOfInterest, downsampling each sample at numReadsDiversity reads. Produce also alpha-rarefaction curves.
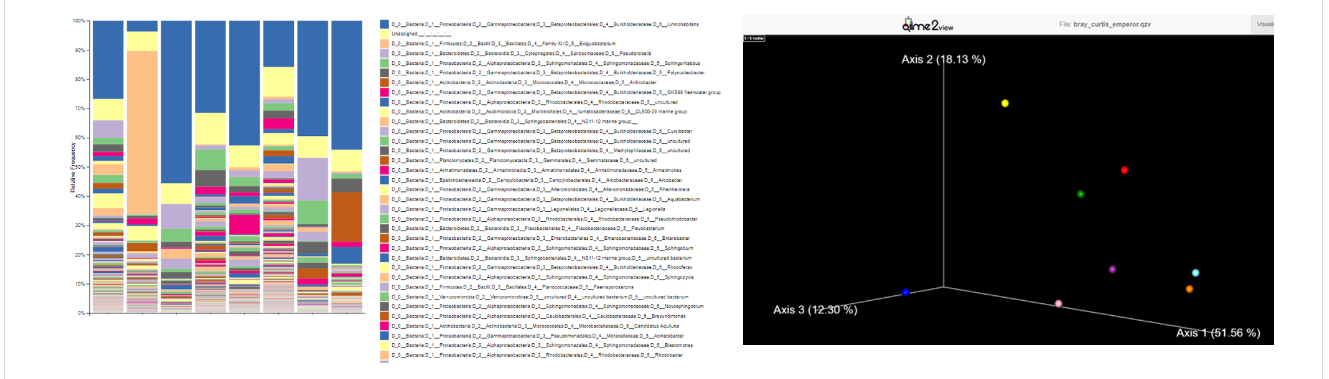
Results visualization
All .qzv and .qza artifacts can be visualized importing them to QIIME2 View.
In particular, you could visualize an interactive multi-sample taxonomy barplot, describing the composition of each sample at the desired taxonomic level, and a PCA plot of Beta-diversity among samples.
Test dataset
A demo dataset composed of 1000 reads named Zymo-GridION-EVEN-BB-SN_sup_pass_filtered_27F_1492Rw_1000_reads.fastq.gz is available. This dataset was obtained re-basecalling with Guppy v 6.2.1 "sup" the dataset generated by LomanLab sequencing Zymo Community Standards 2 (Even) Batch ZRC190633 mock community with R9.4.1 chemistry on a GridION device. The portion of reads corresponding to 16S gene was then extracted using in-silico PCR with 27F-1492Rw primers pair.