Nannopore
In biological labs, biological samples are put into a device called Nanopore. After being put into the device for processing, files containing information in the form of character strings will be given, for example: "ATTGCGTCAG". These character strings are placed in files with the extension fastq.gz or fastq. After obtaining such files, they will be put into the app with the goal of finding the gene sequences of what species they belong to, what their relatives are, what their names are, etc.
To do that, the app will use specialized programs to search for genes and search for gene samples with existing strings in the available databases in the app or users can customize them themselves and bring them into the app to use.
In addition to nanopore devices, there are other devices such as Pacbio, ILLUMINA, DNBSEQ. Because there are many such gene reading devices, the app will have many processing programs for each type of sample from different machines. So when uploading samples to the App, you will choose the type of sample according to each type.
Because the processing method is different for each type of sample, there may be a type that requires 1 program to complete the processing (1 step). But there are also types that require 2 steps to complete the processing, for example Pacbio. In each step, there will be many types of processing programs for users to choose from. For example, in Pacbio, there are 2 steps, to process the sample, the first step is called assembly, the second step is called process, which is the main sample processing step. And when in the assembly step, there will be many programs to choose from such as flye, hifiasm, ...
After the samples are processed, there will be different types of results depending on each type of sample. Some types will have tree images for processing, some will only have files containing ATGC strings. In essence, the images or charts, tree charts are just models from those result files.
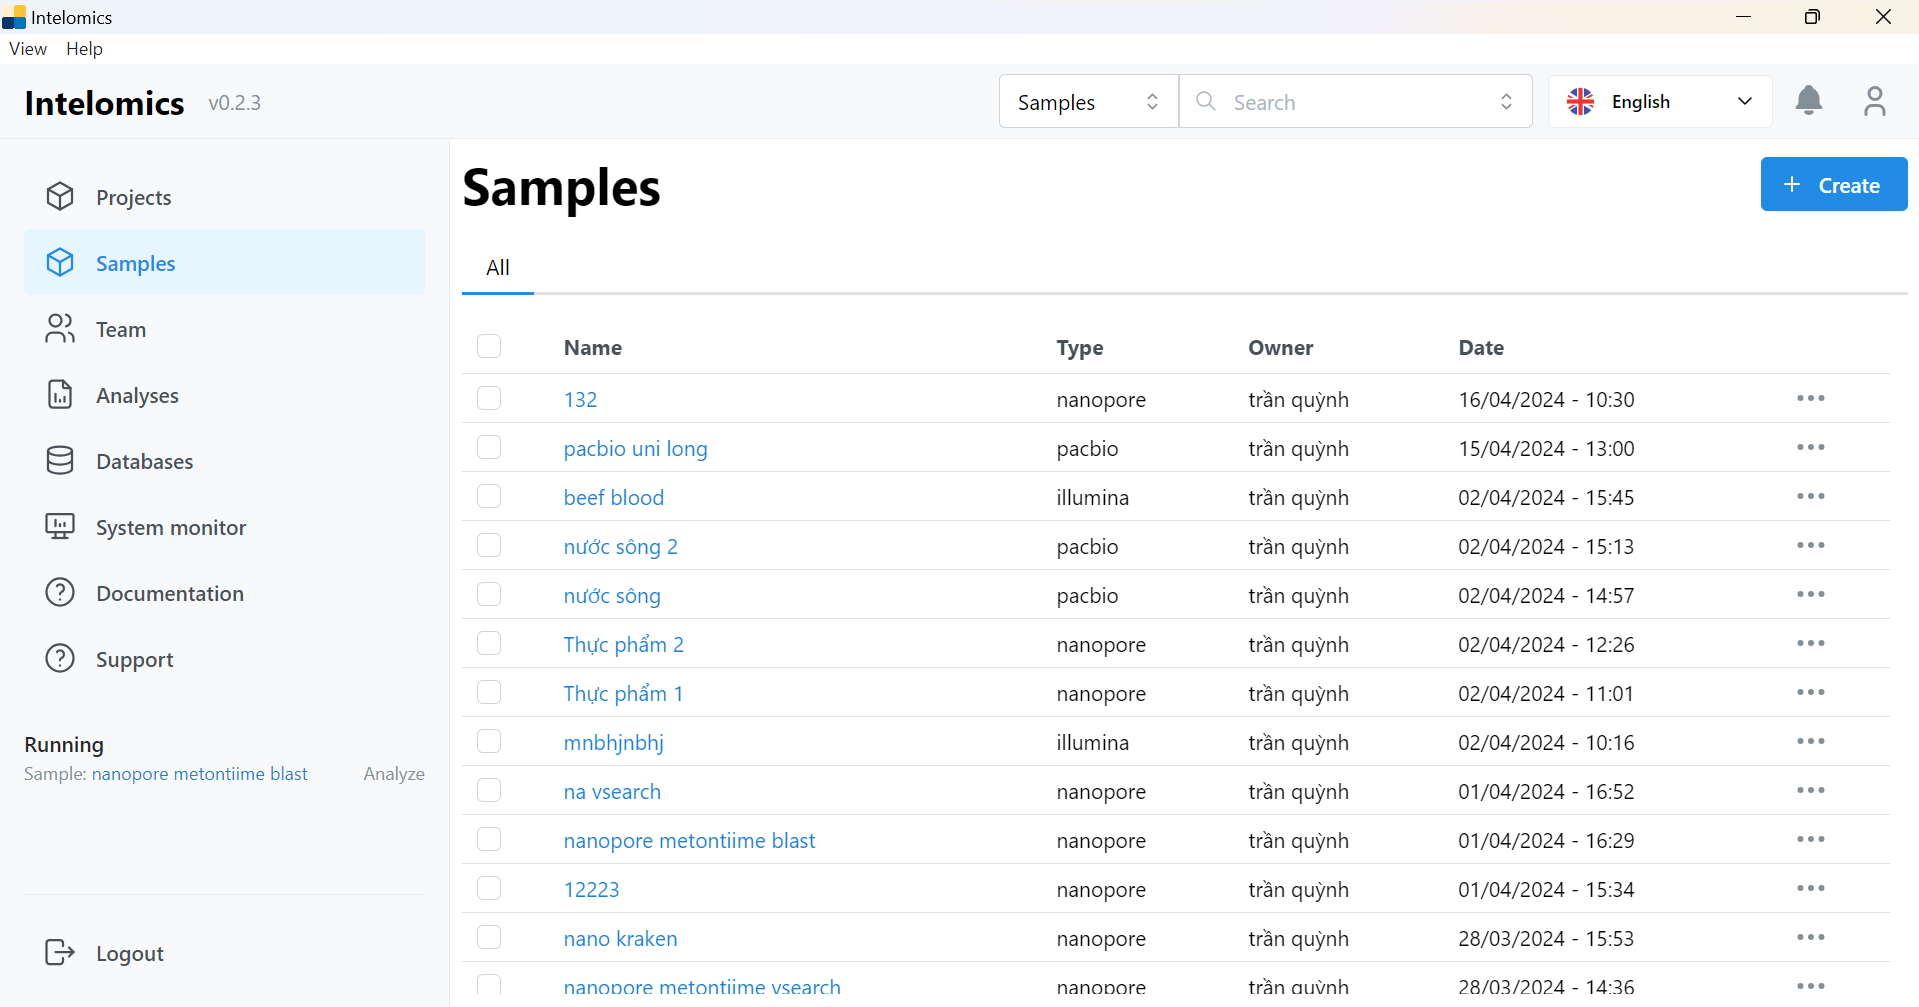 In this image (this is the current app), there are the following items: workbench, project, samples, team, analysis, database, system monitor, documentation, support. Currently, we are only interested in 2 main items: samples and databases. samples will be the place to contain the list of uploaded samples and databases is the place to contain the available databases in the app.
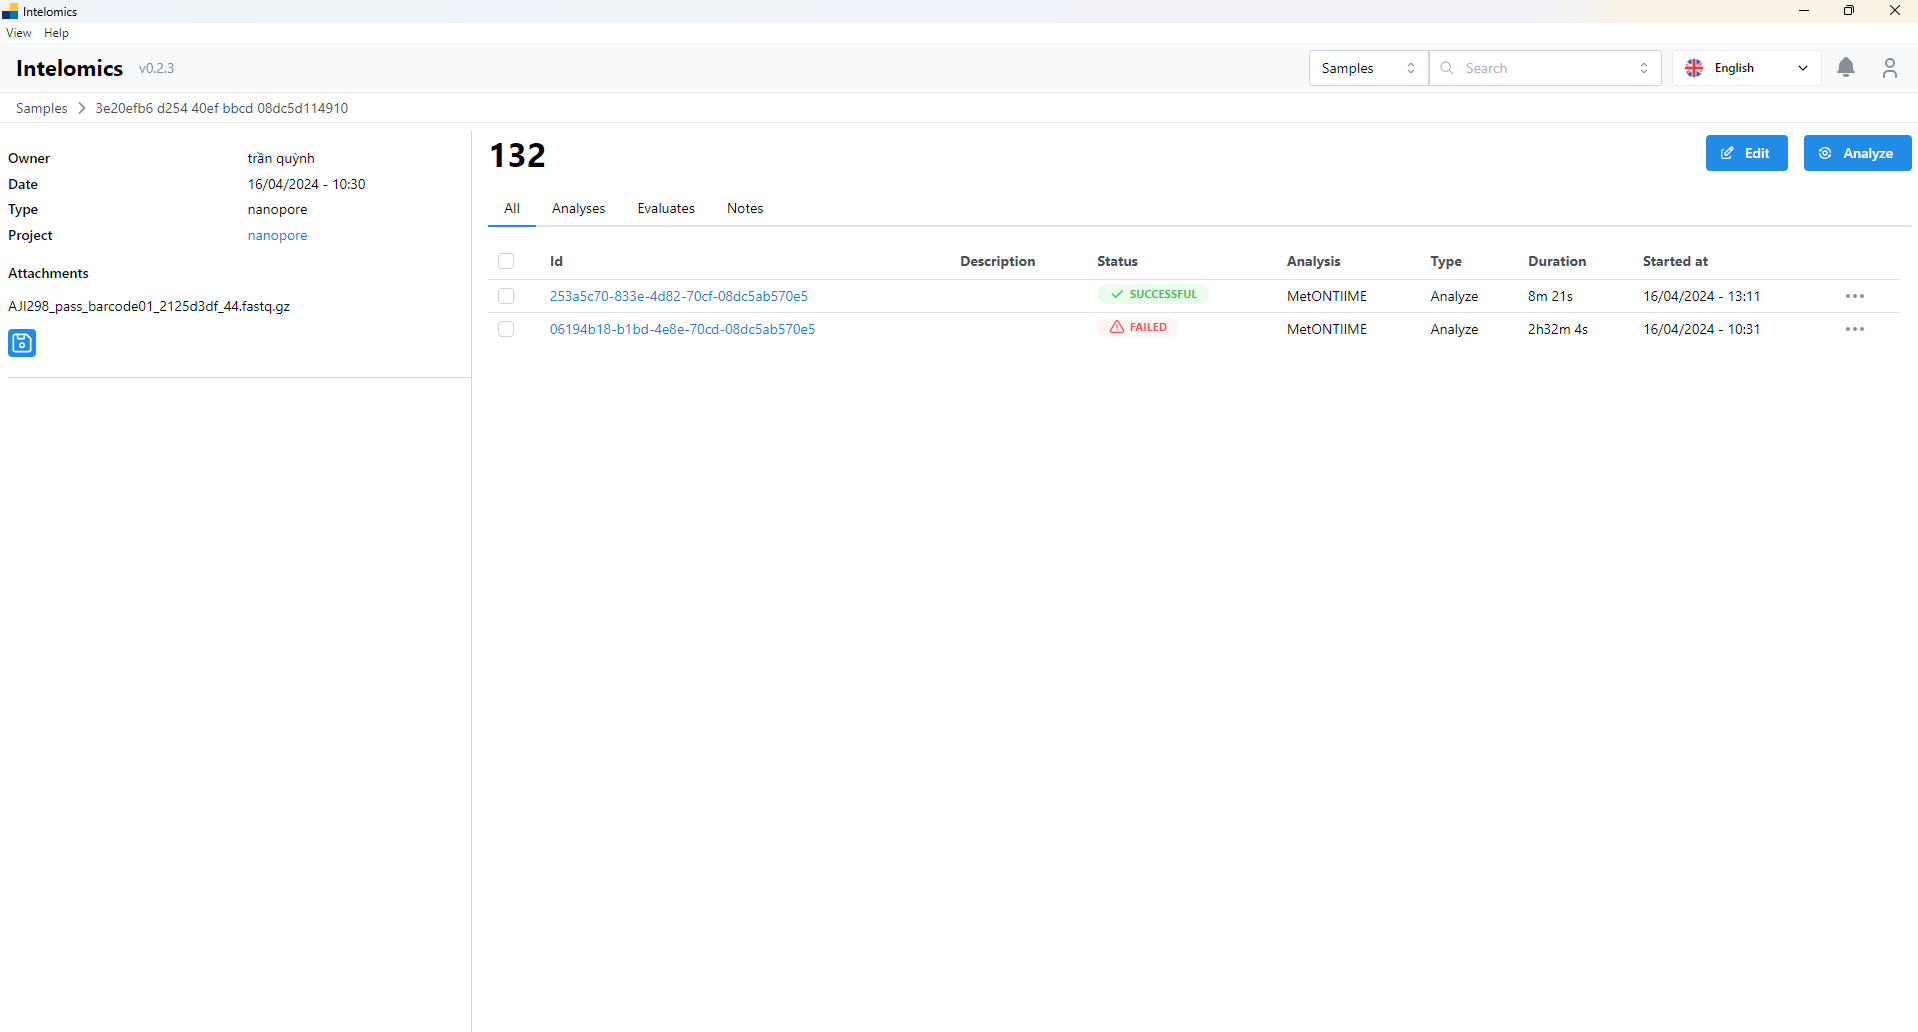 This is the sample screen, inside will contain the runs of that sample, that is, the times that sample is processed, there can be 1 sample but there will be many types of runs with different types of databases.
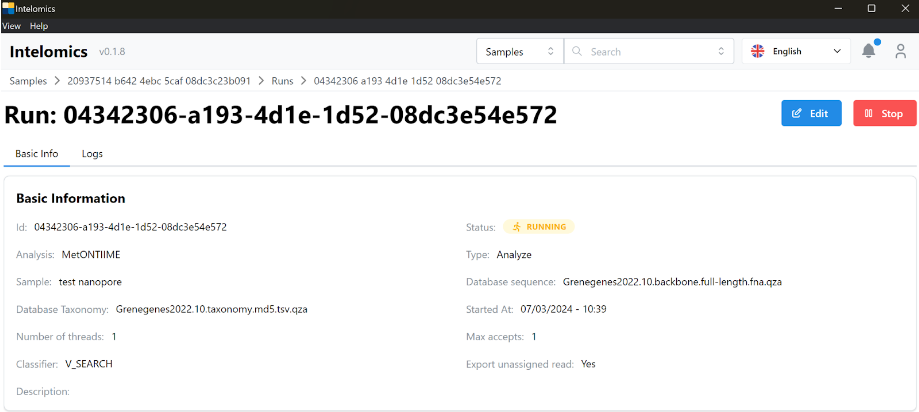
 This is the main screen of a run, it will have 3 items: basic info, logs, results. The first tab is basic info, which will be the basic information of a run such as id, status of whether the run is complete or not, and whether it runs on the cloud or not, what is the name of the program that processes that sample, etc.
Logs tab, with this tab it will display the process when running (processing) a sample. Users will rely on these logs to know what error the run has. For example:
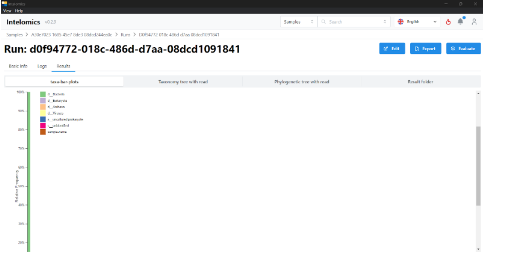
This is the result of a sample run.
⬝Analyze: metontiime
⬝Classifier: V_SEARCH
Result: includes 8 parts: demux-summary, table, rep-seqs, taxonomy, taxa-bar-plots,taxa-bar-plots-no-unassigned,taxanomy tree with read, result folder
3 stages of Metontiime: Clustering /home/processdata/rep-seq.qzv Classify(assign taxonomy) Processing results Signs to identify the finished sorting stage: taxa-bar-plots-no unassigned.qzv Signs that identify the stage of processing the result: table-collapsed-relfeq-level 1.qza Create tree will fail without taxa-bar-plots-no unassigned.qzv All stages have 2 stages after processing: Compress and update if 1 of both is failed, it is considered run fail
-
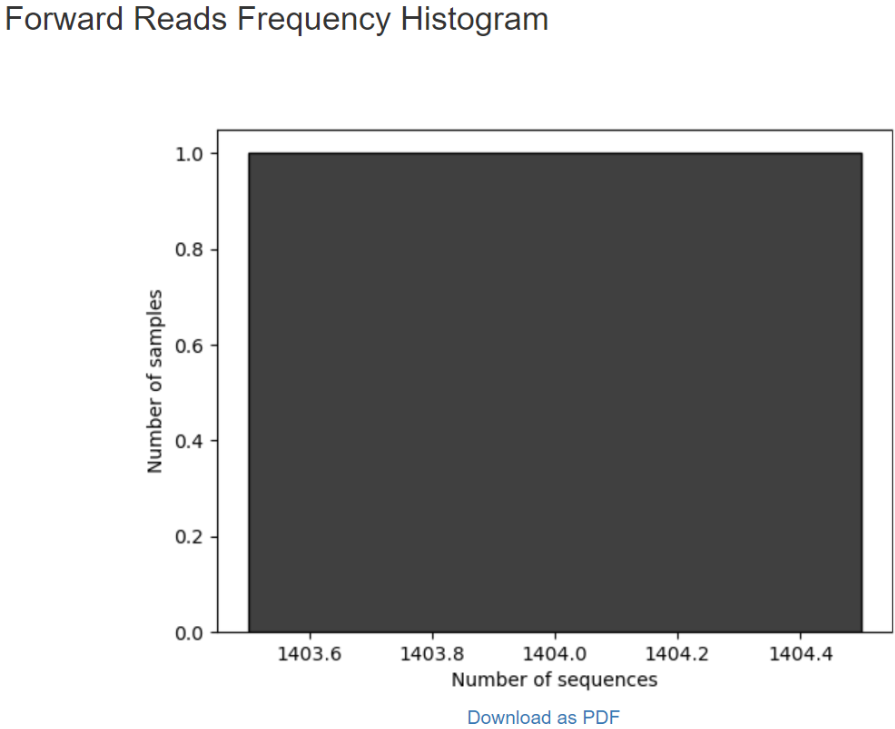
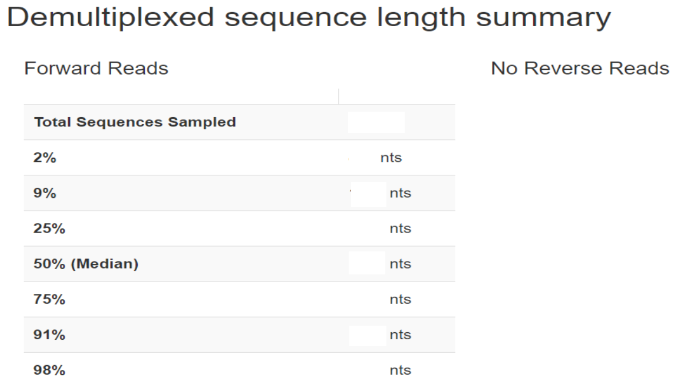
Demux-summary
a. Overview:
Demultiplexed sequence counts summary
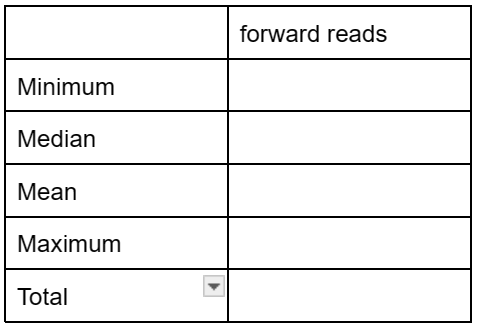
Per-sample sequence counts Total samples: Number forward

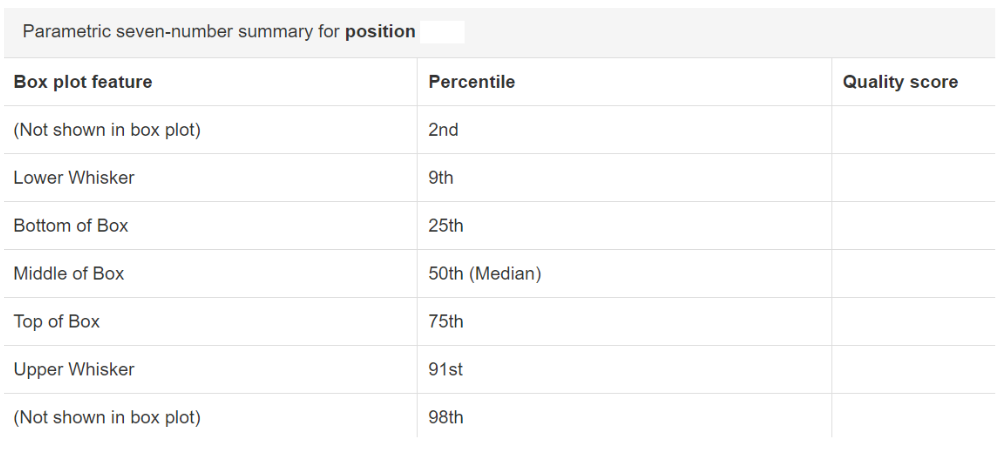
b. Interactive quality plot:
Warning: A subsample value was provided that is greater than the amount of sequences across all samples for the forward reads. The plot was generated using all available sequences.
Click and drag on plot to zoom in. Double click to zoom back out to full size. Hover over a box to see the parametric seven-number summary of the quality scores at the corresponding position.
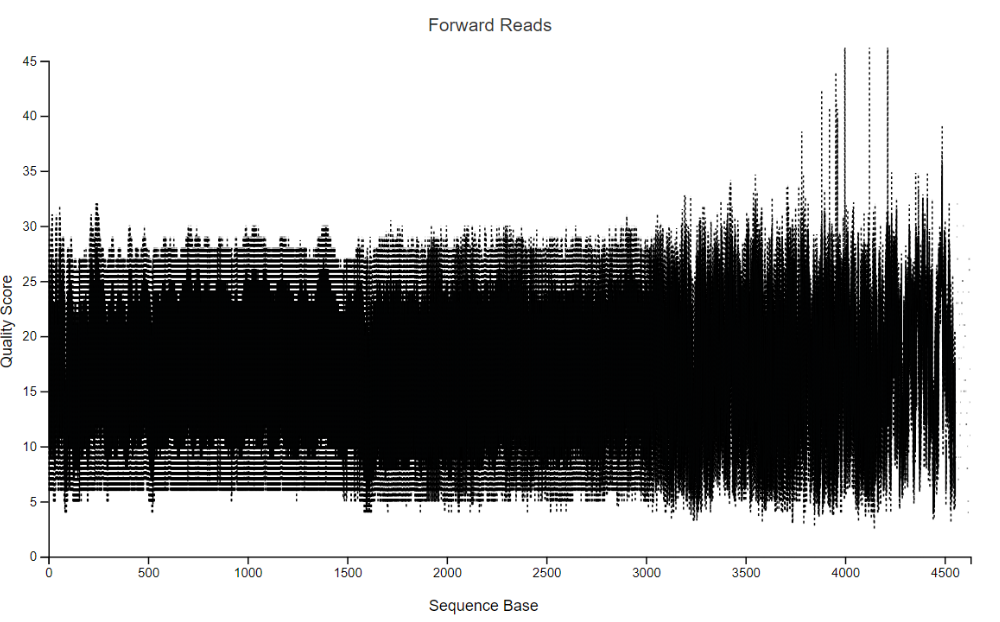
The plot at position … was generated using a random sampling of … out of … sequences without replacement. The minimum sequence length identified during subsampling was … bases. Outlier quality scores are not shown in box plots for clarity.
-
Table
a. Overview
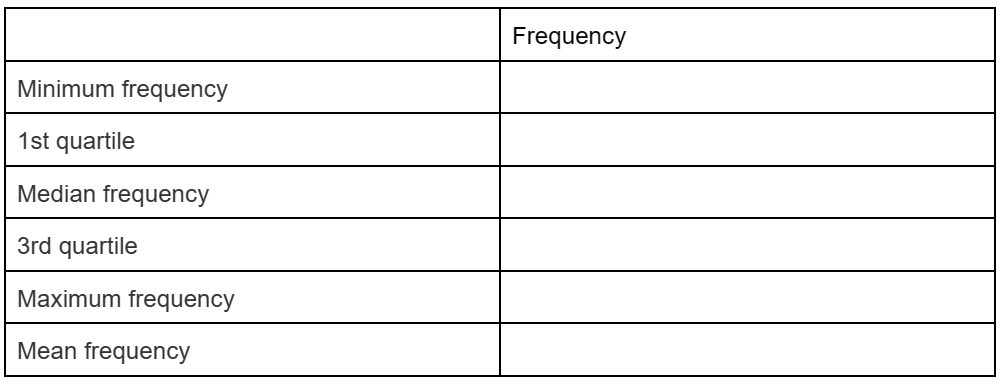
Table summary

Frequency per sample
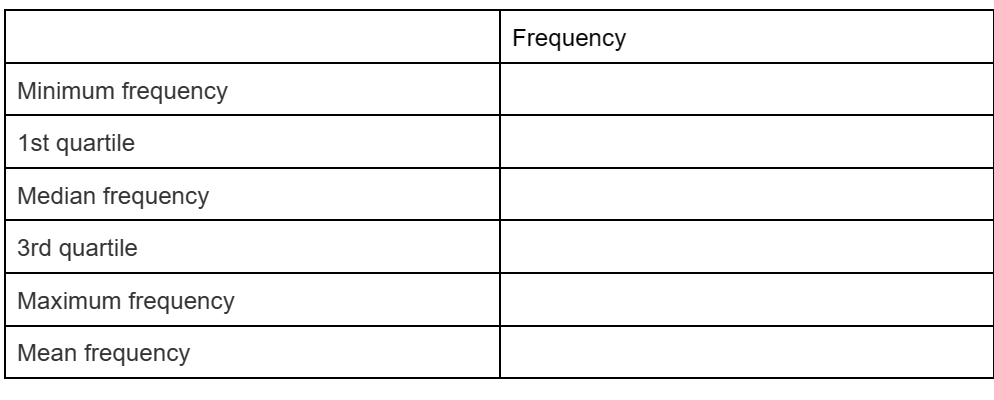
Frequency per feature
b. Interactive sample detail:
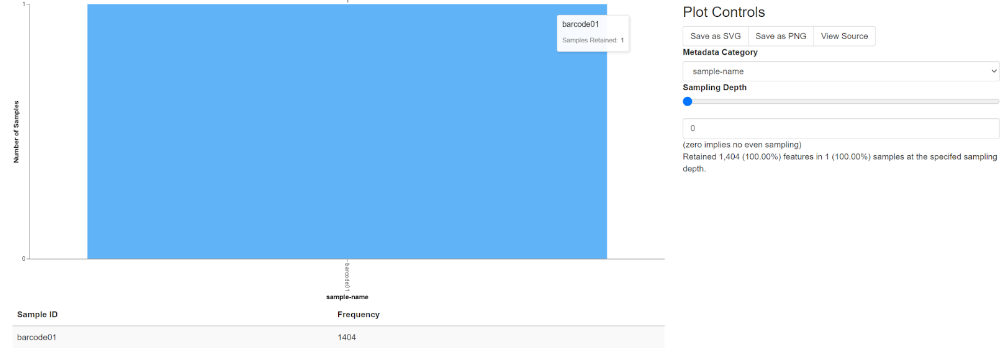
Note that when moving your mouse on the chart, a whiteboard will display the file name and read quantity on samples retained
plot controls
metadata category
sampling depth
c. feature detail
Feature IDs with appearance tiers
- Rep-seqs

Sequence Table
To BLAST a sequence against the NCBI nt database, click the sequence and then click the View report button on the resulting page.
Click on a Column header to sort the table.

- Taxonomy:

A taxon (plural: taxa) is a group of organisms that are classified together based on shared characteristics. Taxa are used in taxonomy, which is the science of classifying and naming organisms. Taxa can range from large groups, such as kingdoms and phyla, to smaller groups, such as genera and species. Here are some common taxa, arranged in hierarchical order from broader to more specific: Domain, Kingdom, Phylum (or Division in plants), Class, Order, Family, Genus, Species. Each taxon represents a level of classification, and organisms within the same taxon are considered to share common ancestry and characteristics. Taxa provide a systematic way to organize and categorize the diversity of life on Earth, allowing scientists to study and understand the relationships between different organisms.
- Taxa bar plots
"Bar width" refers to the width of the bars in a bar chart. In a bar chart, data is represented by rectangular bars with lengths proportional to the values they represent. The width of these bars can vary depending on the design and configuration of the chart. Bar width is an important aspect of bar charts because it affects the visual clarity and interpretation of the data. If the bars are too narrow, it may be difficult to distinguish between them, especially when there are many bars or when the differences in values are small. On the other hand, if the bars are too wide, they may overlap or take up too much space, reducing the overall readability of the chart. Adjusting the bar width allows you to control the balance between the amount of detail and the overall clarity of the chart. It's typically a parameter that you can adjust in the settings or options of the charting software or tool you're using to create the bar chart. By fine-tuning the bar width, you can create a visually appealing and informative chart that effectively communicates your data. Taxonomic level refers to the hierarchical classification of organisms based on their shared characteristics and evolutionary relationships. In taxonomy, the science of classifying living organisms, organisms are grouped into categories or taxa at various levels based on their similarities and differences. These taxonomic levels range from broad categories that encompass many different organisms to specific groups that contain closely related species. The main taxonomic levels, arranged hierarchically from broadest to most specific, include: Domain, Kingdom, Phylum (or Division in plants), Class, Order, Family, Genus, Species. Each taxonomic level represents a distinct rank in the hierarchy, and organisms classified within the same level share certain characteristics and evolutionary relationships. Taxonomic levels provide a systematic framework for organizing and categorizing the diversity of life on Earth, allowing scientists to study and understand the relationships between different organisms.
Color palette:
Discrete: Scheme accent Scheme dark 2 Scheme paired Scheme pastel 1 Scheme pastel2 Scheme set 1 Scheme set 2 Scheme set 3
Continuous: PRGn BrBG PiYG PUOr RdBu RdGy RdYIBu RdYIGn Spectral
Here's the color palette for Qiime's plot-feature bar
Sort samples by ( The percentage in the taxon shows the number of organisms in the sample):
Sample metadata: Index
Sample name Taxonomic abundance: Taxon Unassigned Ascending Descending
- Tax a bar plots no unassigned:
Color palette: Discrete: Scheme accent Scheme dark 2 Scheme paired Scheme pastel 1 Scheme pastel2 Scheme set 1 Scheme set 2 Scheme set 3 Continuous: PRGn BrBG PiYG PUOr RdBu RdGy RdYIBu RdYIGn Spectral
Here's the color palette for Qiime's plot-feature bar
Sort samples by ( The percentage in the taxon shows the number of organisms in the sample):
Sample metadata: Index
Sample name
Taxonomic abundance: Taxon
Ascending
Descending
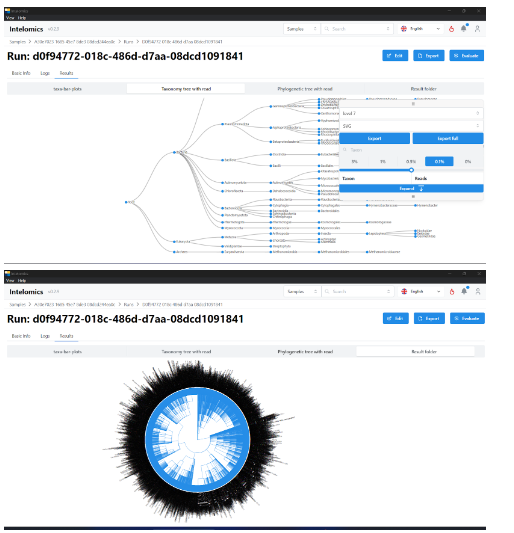
- Taxonomy tree with read
The higher the level, the more visible and complex the chart. We can choose the percentage display to increase or decrease the number of branches displayed. At each point when selected, the name, number of reads, number of creatures in the sample will be displayed.
- Result folder:
QZA and QZV cos files are important files.
Taxonomy.qza: contains information about taxons.
Table.qza: contains information about the sequense. Based on 2 files, it is possible to release diapers corresponding to each sequense.
Rep-seq.qza: is a file containing clustered sequens.